
A New Era of Network Optimization
Price transparency data can help point employers toward health plans that excel at both service and return on investment.
Historically, employers have purchased broad PPO plans covering most healthcare providers, which compete mainly on discount rates (in 2024, 48% of covered workers in the United States were in a PPO plan, according to KFF).
However, additional savings through discounts are now limited. Therefore, employers and benefits consultants are shifting their focus toward optimizing care within existing networks, using strategies like tiering and steerage tied to financial incentives to improve value and outcomes.
To find additional healthcare savings, employers today are focused on applying certain strategies within their existing networks, including tiering networks and steering employees toward high-value, cost-effective care.
Data available under the 2020 federal Transparency in Coverage rule can better inform this process. This information exposes variation in any geographic area in the contracted price for any service, useful in selecting where to go for both types of services and treatment for specific conditions.
The data can be applied to a number of network optimization and steering approaches, including direct contracting, independent plan administrators, and incentives for employees to select certain healthcare providers.
To manage costs and improve care with targeted optimization strategies, brokers and consultants analyze a variety of data (demographic, claims, and quality of care metrics) to identify and diagnose pain points such as healthcare utilization outliers, rising healthcare cost trends, and low-value specialist care for high-cost claimants.
To date, unit prices (also known as price transparency data) have been missing from these analyses. Traditional reporting doesn’t show price differentiation among providers. Instead, carriers and third-party administrators (TPAs) primarily report on cost, which fuses price with utilization, such as average costs per plan participant and across diagnostic categories. Until recently, most price analyses have been based on claims data, masking a more granular set of insights that can be derived from actual or experienced negotiated rates that can be married with critical quality measures such as readmissions, infection rates, and other factors to identify high-value providers within a health plan.
This is poised to change thanks to increased data that is available to the public regarding contracts between carriers and TPAs and providers under the 2020 federal Transparency in Coverage rule. The data exposes the variation in any geographic area in the contracted price for any service. This can assist in identifying contracting patterns and negative and positive deviants across categories of both services (professional, outpatient and inpatient facility, specialty pharmacy) and conditions (mental health, substance use disorder, maternity).
Studies using data from the Transparency in Coverage and the Hospital Price Transparency rules are finding wide discrepancies across the country in the price for procedures of similar quality. In a Third Horizon analysis of the Transparency in Coverage negotiated rates posted in July by the leading carrier networks in the Chicago area, the average discrepancy between the highest and lowest costs for the 10 most common procedures was 808%, with a much smaller discrepancy in quality and often no correlation between quality and cost. Multiple organizations have come to similar conclusions. For instance, the RAND Corp.’s Hospital Price Transparency Study Round 5 report shows hospital market power explains most variations in prices, rather than each hospital’s share of patients covered by Medicare or Medicaid.
This evidence of price dispersion in a given geographic market underscores the benefit to employer plans of understanding provider reimbursement using Transparency in Coverage data and then overlaying it with utilization and provider profiling information to identify healthcare providers that consistently demonstrate high-quality care, optimal patient outcomes, and efficient resource utilization across various metrics including clinical quality measures and cost per episode of care.
We’ll illustrate this approach in two use cases.
Use Case No. 1: High-Volume, High-Cost Services
Let’s take a simple example from one of the states with the highest healthcare costs in the nation: Texas. A handful of health systems dominate the Dallas market, including Baylor Scott & White Health, UT Southwestern Medical Center, Texas Health Resources, and Methodist Health System.
In comparing the MRI Brain procedure (CPT Code 70551) across the major carriers, Baylor University Medical Center (operated by Baylor Scott) receives the highest reimbursement at $2,353, $700 more than Methodist Health’s Dallas Medical Center, the second highest. They are followed in succession by Texas Health Presbyterian Hospital (under Texas Health Resources) and Medical City Dallas (a branch of Medical City Healthcare), which each receive one-fourth of what Baylor is receiving in reimbursement.
This only looks at one outpatient radiology service. The question from here is, are the reimbursement rankings of these health systems broadly the same, or do they change when considering a basket of outpatient imaging services that represent a majority portion of employer spending for employee healthcare? To go a step further, is one system consistently a better deal for outpatient care?
These more granular insights matter because if an employer plan is getting hit hard by imaging costs it can reveal price variation and help purchasers to optimize their networks or at least to direct care to the top network performers who are providing the highest-quality care at the lowest cost. For example, if Texas Health Resources’ facilities appear to be a better deal for outpatient imaging services, an opportunity analysis can then be presented to the employer client with a shared savings program recommendation that would encourage employees to seek care from a Texas Health Resources facility (assuming quality is equal). Employers can nudge employees toward lower-cost providers by offering them gift cards or money back in health savings accounts while still providing them a choice.
We note that Transparency in Coverage data published in machine-readable files (MRFs) doesn’t contain any information about the volume of services by a contracted provider or even whether a provider habitually performs a specific service. That information can be acquired from large claims data sets and is widely available through third-party data resellers.
It is essential to marry large volumes of utilization data with pricing information contained in the MRFs to produce powerful new information for network optimization, such as:
- The actual/experienced average price of care for a service in a geographic area: Simply averaging the rate for each provider in a given market for a specific service doesn’t reveal the average price paid. However, knowing where patient volume is distributed in the market can reveal that information. Weighted rates can then be rolled up into clinical categories to benchmark specific providers in a geographic market against a regional average.
- The provider-specific episode price: Episodes are groups of services that are used to perform a procedure or treat a condition. While the MRFs can help estimate a provider’s episode price you must add the number of services for each type of service to get an accurate episode price. And because practice patterns vary significantly across firms, a fully priced episode based on historical volume, type of services offered, and contracted rates is needed to appropriately compare prices across providers and avoid false positives or false negatives.
- Appropriateness of procedures: Episodes are typically classified as treatments/procedures or conditions. These can be linked by feeding all the claims or clinical data generated for any patient into a software application that will group each claim to one or more episodes to which it is relevant. In that sense, an episode will include all clinically related services provided for a discrete condition or in conjunction with performance of a procedure and the prices paid for them. This allows for assessment of appropriateness of care by provider.
- Failures of care delivery: Episode systems also typically account for acute exacerbations or hospitalizations for a specific condition. They can also track complications that result from a surgery or other procedure. Both are important in better assessing the extent to which plan members may experience more complications with certain providers than others, as well as the financial consequences that result from those complications.
Incentives can also be used to motivate plan participants to choose specific health systems, hospitals, or providers. These incentives typically involve monetary rewards to plan members for selecting preferred-value providers.
Use Case No. 2: High-Cost Claimants
Depending on the circumstances, it may or may not be possible for employers to influence where their employees go for care. For instance, a heart attack goes to the closest hospital. An expectant mother typically goes to the hospital with which her obstetrician is affiliated. However, there are conditions when care can be influenced and patients don’t know that Provider X costs 10 times as much as Provider Y. Knowing this information can save real dollars, particularly with so many Americans in high-deductible health plans.
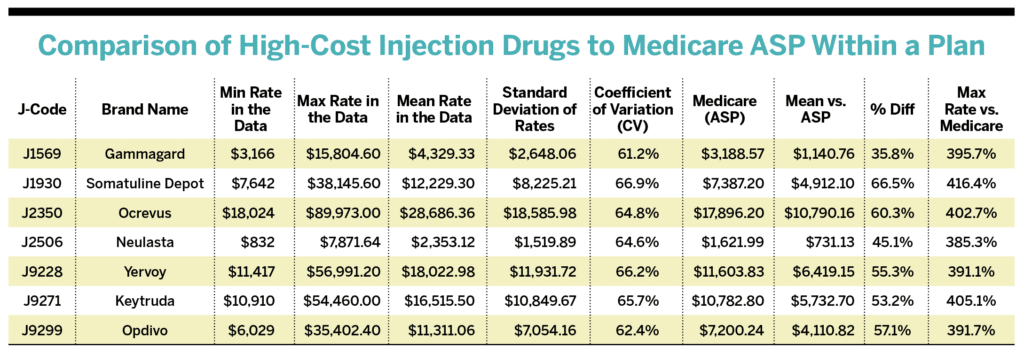
Take physician-administered medications billed under medical coverage. This category refers to high-cost infusion or injection J-Code drugs administered in physician offices and hospital outpatient departments, and has had limited price transparency until recently. The Transparency in Coverage MRFs enable a price analysis that can decipher:
- A plan’s average reimbursement level based on a percentage of the Medicare Average Sales Price (ASP);
- Which providers receive the lowest and highest reimbursement (and which fall into the mean/minimum/maximum); and
- Whether the variation in reimbursement level by J-Code is consistent.
Here’s an example from the Boston market from February 2024. The following table compares a regional carrier’s J-Code provider rates to Medicare ASP.
INSIGHTS:
- On average, this carrier network reimburses providers 36%-67% more than Medicare ASP for these J-Code infusions.
- Providers receiving the highest reimbursement from this carrier are approximately 400% over Medicare ASP for each J-Code.
- Variation in carrier reimbursement is fairly consistent by J-Code with CVs of 61%-67%.
- Of the major health systems, Massachusetts General Hospital and UMass Memorial Health have consistently the highest rates from this carrier for these drugs, with independent physicians’ groups and clinics in the East and South End of Boston and in Lexington-Concord notably more cost-effective at half the cost.
- Looking at the Place of Service Codes further reveals phenomenal price variation (i.e., five to 10 times) based on the type of facility or setting where the patient received the drug. This means that even within one health system or provider group, depending on what facility you go to, there could be wide price variation for the exact same drug.
This information, pulled together in a market where an employer or a group of employers has a concentration of lives, can enable curating a designated provider list that plan members must go to or be considered out of network. Plan sponsors could also introduce the incentive on the benefit design side, i.e., your deductible for these providers will be much less, or you’ll pay double.
As an aside, many physician-administered medications are Medicare Part B-covered drugs. As such, Medicare is now negotiating prices with drug manufacturers under the Inflation Reduction Act, which could reduce prices for some of these products. This will be an interesting category to watch for price changes and variation this year.
These two use cases have demonstrated the potential value of using TiC data to steer health provider choices. Here’s how employers can approach this task.
Implementing Network Optimization and Steerage
DIRECT CONTRACTING
As a general matter, analytics tools that leverage available price transparency data, quality of care metrics, and provider/hospital directory data to instantly provide the type of information seen in the chart will increasingly become more commonplace. This could lead to higher rates of direct contracting and more appetite for network deconstruction and reconstruction. For example, midsize companies in an employee benefits captive might be more apt to negotiate a base diagnosis-related group rate directly with a health system for a small set of outlier inpatient services in a bundled payment contract. There is a relatively small list of inpatient procedures that inherently create significant exposure for employer plans and are not urgent services, such as transplants and high-risk pregnancies. Many organizations know this is a surefire way to reduce the price, but they often fear direct contracting because they have not done it before and don’t know what they don’t know. However, there are companies that specialize in direct contracting for clients, making this strategy manageable.
INDEPENDENT PLAN ADMINISTRATORS
Another alternative is identifying third-party administrators with strong network optimization capabilities and the willingness to build flexible networks that meet the specific needs of an employer’s workforce. However, the market dominance of the major carrier-owned TPAs makes this challenging through the contractual limitations they stipulate. In addition, most employers are reticent to make a wholesale switch. This may change as more strong independent plan administrators fed up with the status quo develop better models for self-insured employers. That includes companies like Centivo and XO Health: newer organizations working to proactively help employers manage more affordable healthcare.
TIERED NETWORKS
The easier and more conventional pathway in the beginning stages of directing employee care will involve implementing steerage strategies through an existing plan’s benefit design. This creates minimal disruption and avoids contractual adjustments with carriers or TPAs. Tiered networks are one example of steering through the benefit plan design. With tiered networks, employers can designate certain health systems, hospitals, or providers as preferable. Tiers can range from best value to greatest choice. They can include care administered in various settings, including hospitals, health systems, stand-alone facilities, virtual platforms, or even in-home settings.
INCENTIVE PROGRAMS
Generally, Tier 0 or Tier 1 options come with no or lower costs to plan participants, encouraging their use. Offering healthcare with $0 copays for select providers would motivate individuals to use those providers. This incentive encourages enrollees to play an active role in their health through use of preferred-value providers for preventive care and shoppable procedures. Employees still have the option to see other providers based on specialty and need.
Incentives can also be used to motivate plan participants to choose specific health systems, hospitals, or providers. These incentives typically involve monetary rewards to plan members for selecting preferred-value providers. Incentive programs are often implemented externally to the benefit plan and can take more thoughtful effort to implement. For true value to be actualized, a care navigation feature must be integrated with the plan, displaying information on providers and facilities and where services are fairly priced.
Several care navigation vendors (including Embold Health, Garner Health, and Healthcare Bluebook) bolt onto employer plans to provide a central view of in-network providers, digital navigation of available treatment options, associated costs, and quality metrics linked to HSAs or HRAs. Through a simple login on the employer-provided website, users can search, compare, and review detailed information on doctors’ specialties, strengths, and experience, ensuring they get the help they seek at a fair price that optimizes ROI for the employer.
Plan sponsors can also get creative in their incentive programs. For example, if a plan sponsor has sensitivity over offering large, direct dollar-value incentives for specific procedures that not every member is eligible for, an option could be to tailor the incentive to the procedure or care a member receives. For example, a member giving birth can receive a year’s supply of diapers, wipes, and formula, delivered to their door, for going to an optimal hospital or birth facility. There is a real opportunity to innovate on incentives with a suite of customizable rewards for specific behaviors.
This all boils down to educating patients and encouraging them to use high-value providers. The only way to lower healthcare costs substantially is to provide shareable data that employers can use to educate plan beneficiaries.
An example from Wisconsin illustrates the value of this approach. In 2022, an employer purchasing coalition in the state used steerage to guide employees to high-value care. Excluding the top 5% of high-cost claims, these employers saved more than 20% per member per month.
Steerage is a proven strategy. And now we have more data to do it better, which is why steerage is poised to define the next era of employer health benefits.